On-Chain Metrics for Beginners: Active Addresses, Fees and Realized Cap
Active addresses, fees and realized cap show how a network is actually being used. Here is what each...

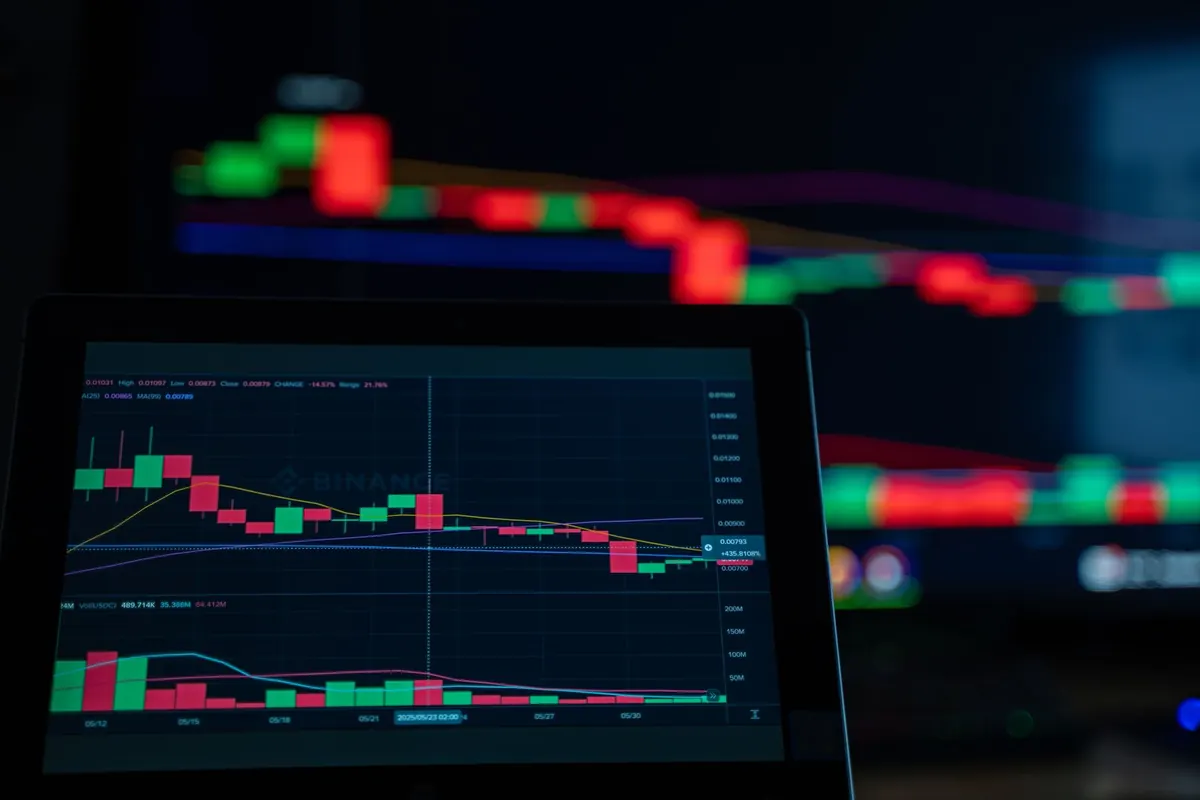
Open any crypto chart and you are greeted by the same thing: a wall of green and red bars that seems designed to make you feel late. Here is the reassuring part. A candlestick chart is not complicated. Each candle compresses four numbers — open, high, low, close — into one shape. Learn to read those four and the picture stops looking like noise.
What follows is the version of technical analysis that actually helps a beginner: no indicator stacking, no secret patterns, no promises. One chart, fifteen minutes of attention, and a routine you can repeat on any coin you are curious about.
Every candle covers a fixed window of time and holds four prices from that window: where it opened, the highest point reached, the lowest point reached, and where it closed. The thick part — the body — spans the open and the close. The thin lines above and below are wicks, sometimes called shadows, and they mark the extremes.
Colour is shorthand. On most crypto charts, a green candle closes above its open and a red candle closes below. Some platforms use hollow and filled bodies instead, so check the legend once and then stop thinking about it.
Body size is the detail beginners underrate. A long body means price moved decisively from open to close: one side showed up and stayed. A short body, particularly after a strong run, means buyers and sellers fought to something close to a draw. Neither is a buy or sell signal on its own. Read a candle as a description of effort, not a verdict.
An example helps. Say a one-hour candle opens at 100 and closes at 103. The body is three points, the colour is green, and if the high was 103.2 with a low of 99.6, the wicks are thin — an orderly session where the closing price sat near the top of the range. Now imagine a candle that opens at 100 and closes at 100.1, but traded as high as 108 along the way. Tiny body, long upper wick. Same hour, completely different story: price was pushed up and then sold back down hard. Those numbers are hypothetical, but the shapes repeat on every exchange, every day.
A wick records what price did that the close does not show. A long lower wick means sellers drove price down and buyers pushed it back before the candle closed — demand appeared at that low. A long upper wick means the opposite: buyers tried, sellers absorbed the move, and price finished lower than its peak.
One candle is a sentence. The twenty candles before it are the paragraph.
That is why a dramatic-looking candle in isolation is close to meaningless. A long lower wick in the middle of a quiet range is a shrug. The same wick landing on a level where price already bounced twice is worth a second look. Context does the work; the candle just reports it.
A candle's meaning depends entirely on how much time it covers. Each candle is just a container: one four-hour candle holds four one-hour candles inside it, and a daily candle holds twenty-four hours of trading compressed into a single shape.
One-minute crypto charts are dramatic and mostly noise. They are useful for execution and close to useless for learning structure. Start with the daily chart to see where price has been over months, then drop to four-hour or one-hour candles to see how the current move is being built. If a pattern only exists on the five-minute chart, you are probably looking at randomness with a nice outline.
Pick three timeframes and keep them consistent: daily for direction, four-hour for structure, one-hour for timing. When the three disagree, the higher timeframe usually wins the argument. A single daily candle turning green inside a strong downtrend is not a trend change; it is a pause.
Under the price panel sits a row of bars, one per candle, showing how much was traded in that period. Volume answers a simple question: did anyone actually participate in that move?
One caveat: crypto volume is spread across many exchanges, so the bars on your chart reflect only the venues your platform aggregates. Use volume for comparison within the same chart — is this move bigger or smaller than the last one? — rather than as an absolute number.
Support is a price area where buyers have previously stepped in; resistance is where sellers have. Notice the word area. These are zones, not laser lines, and the chart looks cleaner the moment you accept that.
To find them, work from the higher timeframe down and look for places where price reversed at least twice, or where it stalled for several candles before continuing. Then draw a band across the bodies of those candles rather than a single line through the wicks. Three or four zones on a chart is plenty. Fifteen is decoration.
Here is the whole thing in sequence. Set a timer the first few times; the routine matters more than the minutes.
That last step is the one people skip, and it is the one that pays. A chart does not tell you what will happen next; it tells you what has happened and where the pressure sits. Writing a plain sentence forces you to separate observation from hope, and after a few weeks the sentences get shorter and sharper.
Expect to be wrong often. Early on, the win is correctly describing a chart, not correctly predicting it. Read one coin this way every day for two weeks and the shapes will start to feel familiar rather than intimidating.
A final note: reading candles is education, not financial advice. Crypto is volatile and you can lose money quickly. If you are making decisions with money you cannot comfortably afford to lose, speak to a licensed financial adviser before acting.
Active addresses, fees and realized cap show how a network is actually being used. Here is what each...
A practical 12-point checklist for vetting new crypto tokens: contract permissions, liquidity locks,...
A practical guide for English-speaking residents in Italy on picking a registered exchange, reporting...